Related
USDA Releases New Plant Hardiness Zone Map

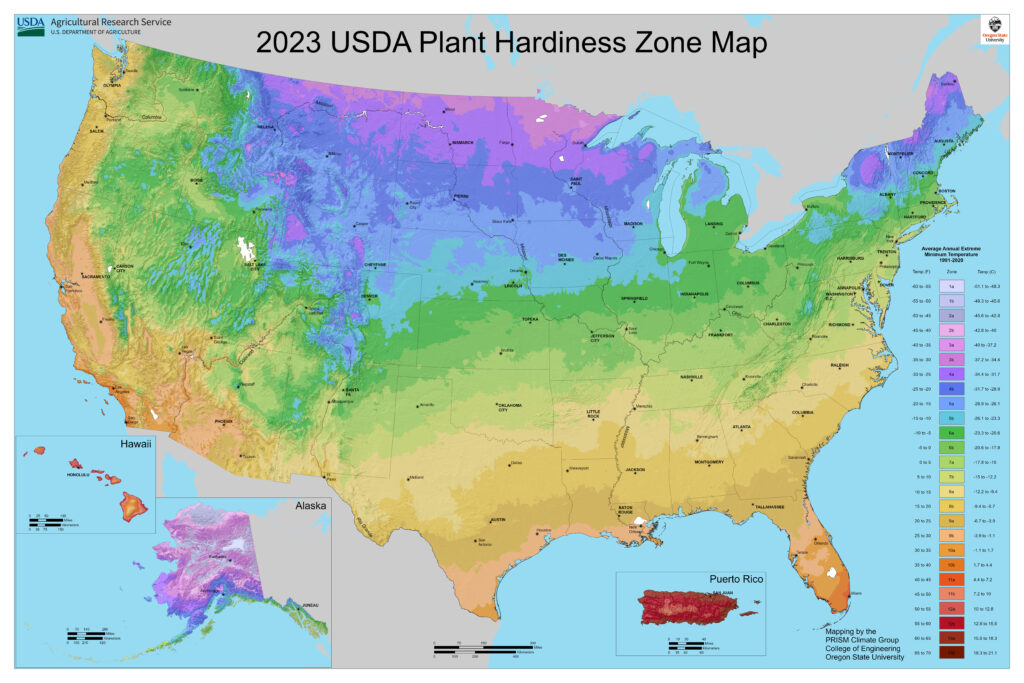
Year in and year out, gardeners across the country consult the U.S. Department of Agriculture’s Plant Hardiness Zone Map to determine which plants are most likely to thrive in their location.
And, thanks to a new map released by the USDA in mid-November—the first update to the map since 2012—many gardeners will be planting some new varieties of open-pollinated flowers, fruits, and vegetables for the very first time this spring. According to Chris Daly, director of the PRISM Climate Group at Oregon State University (which jointly developed the map with the USDA), the 2023 map is about 2.5 degrees Fahrenheit warmer than the 2012 map across the contiguous United States.
The USDA notes that the 2023 map is based on 30-year averages of the lowest annual winter temperatures at specific locations, divided into thirteen 10-degree Fahrenheit zones, and further divided into five-degree Fahrenheit half-zones (designated as “a” and “b.”) The 2023 map incorporates GIS data gathered from 1991-2020 from 13,412 weather stations, compared to the 7,983 that were used for the 2012 map.
Plant hardiness zone designations represent the “average annual extreme minimum temperature” at a given location during a 30-year time period. As gardeners well know, low temperature is a crucial factor in the survival of plants at specific locations.
In the newly released map, approximately half of the country has shifted to the next warmer half zone, while the other half of the country remained in the same half zone. According to the USDA, that shift to the next warmer half zone means those areas warmed in the range of 0-5 degrees Fahrenheit. (Some locations experienced warming in the range of 0-5 degrees Fahrenheit without moving to another half zone.)
Note: Plant hardiness zones are based on 30-year averages of weather extremes (coldest temperatures). Climate changes are based on overall annual average temperatures over 50-100 years. Temperature updates to plant hardiness zones are not necessarily reflective of global climate change because of the highly variable nature of the extreme minimum temperature of the year, as well as the use of increasingly sophisticated mapping methods and the inclusion of data from more weather stations.
Gardeners and others can find the new map online here.